A shot chart is a map of the court that colours each zone by your shooting percentage. Hoop builds yours automatically from every shot you log across 14 zones, so your hot and cold spots are obvious at a glance.
Track your shot chart free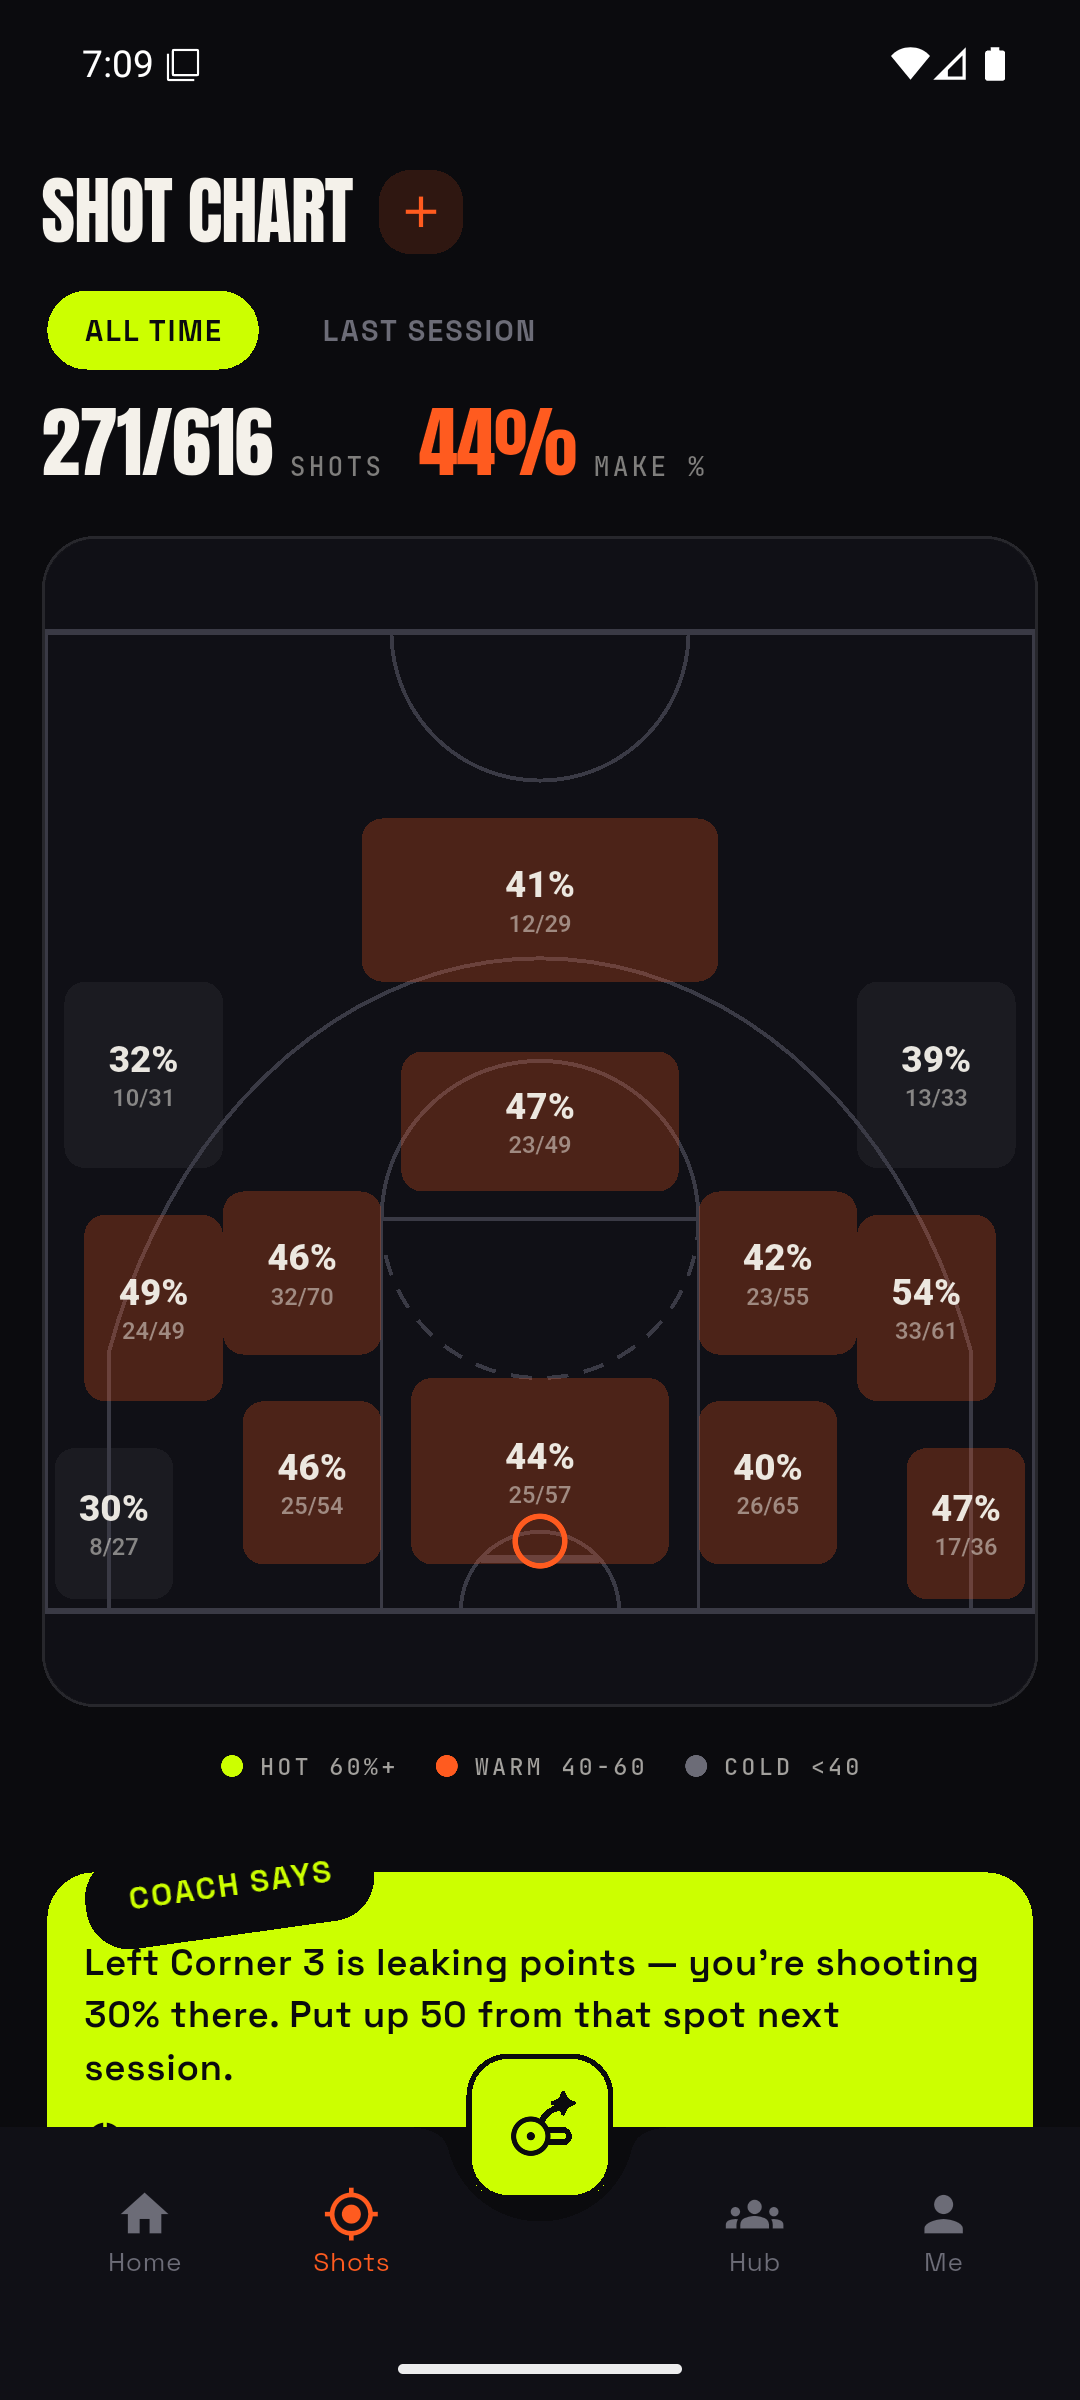
From the restricted area to both corners and the top of the key — the same zones coaches actually talk about.
Green means you're deadly, red means the reps need to go there. Percentages and makes/attempts on every zone.
The AI coach reads your coldest zones and turns them into a targeted drill for your next session.
Each time you log a make or miss, Hoop assigns it to one of 14 court zones and updates that zone's shooting percentage. Over time the chart shows exactly where you score best and worst.
Yes. Shot tracking and your shot chart are free on Hoop. Pro unlocks extras like unlimited AI analysis and data export.
Yes — switch between your all-time chart and your last session to see how you shot on any given day.
Plain-language breakdowns of your form and stats, weekly report cards and video analysis — coaching that reads your real numbers.
Dozens of guided drills and multi-day plans give you a structured path — beginner to advanced — instead of aimless reps.
Log real pickup games on the court where you played them. Head-to-head records, win streaks, bragging rights.
Every session earns XP. Climb 10 ranks and unlock 12 achievements — the grind finally keeps score for you.
 Hoop
Hoop